What if Carlisle Barracks went back to a “business as usual” model and faculty, staff, or students happened to be infected with COVID-19?
Throughout the United States, governments are trying to devise strategies to return to normalcy following the shutdowns caused by COVID-19. Carlisle Barracks is no different and has been having consistent virtual town hall meetings to discuss updates and ways to move forward. However, what if Carlisle Barracks went back to a “business as usual” model and faculty, staff, or students happened to be infected with COVID-19? How long would it take the virus to spread throughout the installation? How many people would ultimately become infected and even die? In this article, I use epidemiological modeling to answer these questions.
The frequency data from Johns Hopkins of new COVID-19 infections in Pennsylvania indicate that the leadership on Carlisle Barracks implemented mitigation strategies at the best time possible. If Carlisle Barracks opens too early and the virus is introduced into the population, we could see widespread infection and 33-55 deaths. Thus, the results of this simulation suggest that continued mitigation strategies are still required even after faculty, staff, and students resume in-person work. However, it should be noted that these results do not consider age and gender of the population. Due to the increased risk to the War College faculty, the estimates generated in this study are conservatively low.
COVID-19 Research at the USAWC Center for Strategic Leadership (CSL)
In February, before I started analyzing COVID-19 data, Professor of Strategic Futures Kris Wheaton was working on projections about COVID-19’s impact on the United States. Based on airline flight patterns and transmission rates of the virus, Wheaton predicted New York would be one of the cities hardest hit even though there was not a single positive case reported in NYC to date. Professor Wheaton promptly informed the Homeland Defense and Security Issues Group, doctrine representatives in the Center for Strategic Leadership (CSL), and the Strategic Landpower and Futures Group Director, COL Greg Smith.
A simultaneous effort was underway by Ben Leitzel, Professor of Cyber. Leitzel took the available data on at-risk populations and closely tracked infection frequencies to calculate the fatality rates within assisted living homes. As many faculty at the Army War College fall under the at-risk age group, Professor Leitzel knew the proportion of at-risk individuals on Carlisle Barracks could be greater than the general population. Professor Leitzel began to work with CSL leadership on preparing for possible changes at the War College.
A COVID-19 Simulation at Carlisle Barracks
One of the best ways to determine the effectiveness of mitigation strategies, such as social distancing, is using calculus and linear algebra to calculate the result of a specific epidemiological model called a SIR (Susceptible, Infected and Recovered) model. These methods are commonly used to model communicable diseases. I used this modeling technique to determine how the virus would impact the Carlisle Barracks population if carriers of the virus worked and interacted with those on post.
I used parameters that have been gathered around the world to simulate an epidemic of COVID-19 at the United States Army War College. The total population of the installation, including employees and residents, is 1615. I set the number of exposures to 10 per day; however, this may underestimate the true number of exposures due to choke points like doorways—where nearly everyone will touch such a surface. The probability of contracting COVID-19 is not 100%. Many people have been exposed to people who are infected with COVID-19 and not become infected themselves. Because probability of infection is low, I set the probability parameter to 0.05. Lastly, I set the recovery rate at 0.05 which gives the model a mean recovery rate of 20 days with a median recovery rate of 14 days. Most people recover within two weeks, but some, like older or other at-risk populations, may take longer to recover. The simulation does not take age or gender into account. These parameters are substantiated by the R0 values generated by the model and the similar R0 values reported by Johns Hopkins University researchers.
In Figure 1. the number of infections indicated by the red line spike dramatically within the first two weeks and reaches the peak number of infections about three weeks into the epidemic. This exponential growth pattern is common all over the world. The corresponding number of susceptible individuals (the yellow line) goes down because they have now joined the infected group. The green line represents individuals who recovered from the virus.
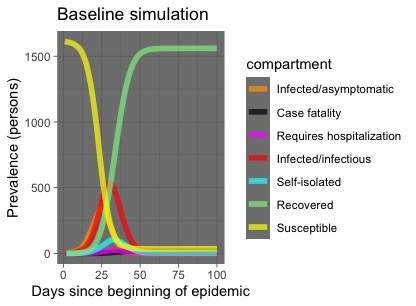
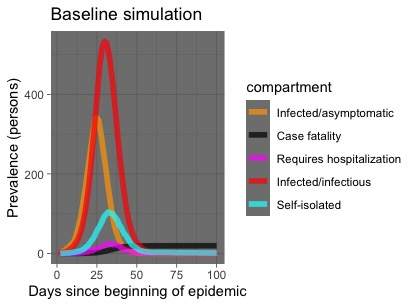
Figure 2. represents the same baseline simulation but the Susceptible population and Recovered population have been removed. This allows for easier visualization of infections, hospitalizations, and fatalities. Notice at the peak of the epidemic, there are nearly 500 people infected and exhibiting symptoms and over 300 people infected but asymptomatic. Self-isolated means a presumed-positive case, with no positive test. However, it should be understood that the solid red line represents a mean estimation of all infections.
These numbers look frightening, but they do not take into consideration the telework order many students, faculty and staff received about a month prior to writing this simulation. Continuing a telework strategy would almost guarantee the prevention of an epidemic breaking out on Carlisle Barracks; however, in-person work will eventually have to resume.
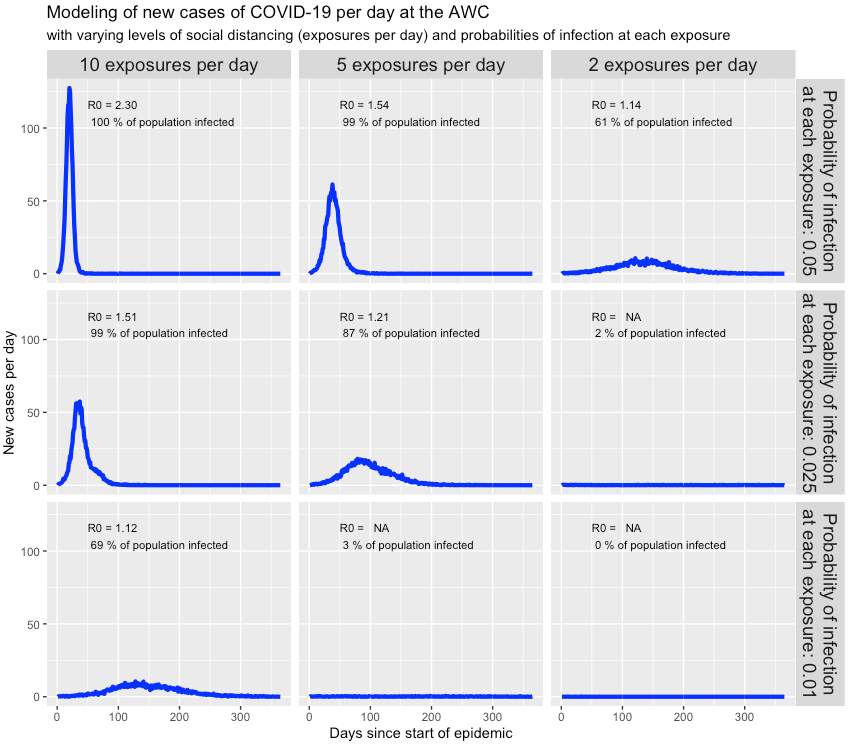
Figure 3. represents the number of infections based on various mitigation strategies and adherence to social distancing protocols. For clarification, social distancing means staying two arms lengths (six feet) away from people, limiting group interaction, and avoiding crowded places. This change seen in Figure 3. is reflected by reducing the number of exposures per day from 10 to 5 to 2. The graph in the upper left shows a ‘business-as-usual’ approach if everyone stayed on post and with no change in behavior. Even with strict social distancing, the model suggests an infection of 61% of the Carlisle Barracks population. This high infection rate signifies that social distancing alone is not enough.
One way to decrease the probability of infection is by following the Department of Defense’s Health Protection Condition (HPCON) guidelines. Some of these guidelines include hand washing and wiping down commonly-used surfaces. Implementing these HPCON strategies would have a substantial impact on the percentage of infected individuals, but its only slightly better than the social distancing strategy when used alone.
Coming Back to Work with a Contagious Host
It is understandable to want return to normal working conditions. Despite this desire, there is always the possibility for Carlisle Barracks to come back from teleworking and for one or two or three individuals to unknowingly spread the virus. Asymptomatic carriers are common, and the incubation period can be up to two weeks, so the virus can spread before anyone knows there is a problem. To model this, we look at what would happen if symptoms did not appear for a week and if mitigation strategies were ordered on the first day of returning to in-person work, and assuming everyone came back to work at once.
Figure 4. shows a scenario in which the faculty return to work, and leaders order those with symptoms to self-isolate and telework (if they are healthy enough). Notice that the number of infections has declined, but a large number of asymptomatic people infecting others remain, ultimately causing several hospitalizations and a number of deaths.
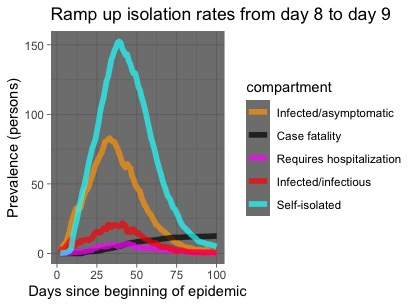
Figure 5. shows a better visualization of those extreme cases that involve hospitalization or death. While there is a substantial decrease in deaths and hospitalizations, we can expect to see around 8 or 9 hospitalizations each day from Day 30 to Day 40, and 13-14 deaths by the time the virus finally burns out.
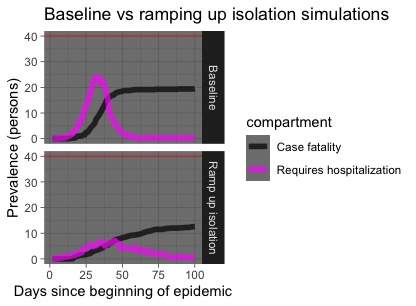
Figure 6. represents three experiments that can be compared to the baseline model. The first experiment (the second from the top) has already been explained in Figure 4. The third model in Figure 6. contains the introduction of social distancing starting the first day back to in-person work on post, but nothing else. This experiment is similar to the top row of graphs in Figure 3. Notice in both figures that this strategy alone does not produce desirable results even with the meaningful reduction in infections, hospitalizations, and death. The last experiment in Figure 6. depicts the strict social distancing and quarantine from Day 1.
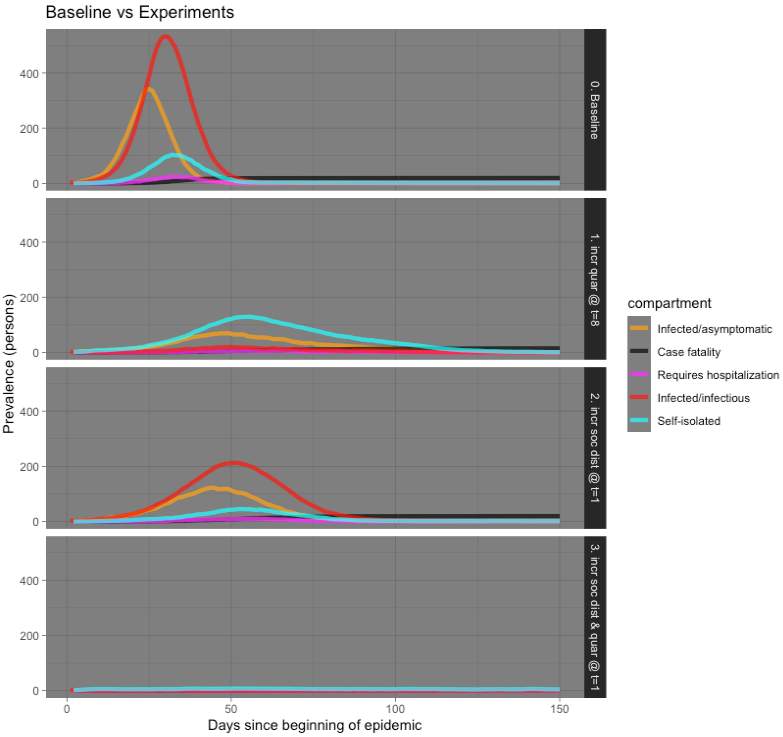
It becomes clear that each strategy by itself is not acceptable. First, the business-as-usual model in Figure 3. shows a 100% infection rate before the virus burns out. This translates to approximately 55 deaths at Carlisle Barracks. Second, even while using one of the mitigation strategies, we could expect between 33 and 38 deaths on post. Using more conservative R0 values that may reflect the virus dying out across the state still produces a considerable amount of case fatalities on post. Mathematically, the optimal strategy would be to continue a work-from-home protocol. However, in the event in-person work continues, strict social distancing and adherence to HPCON guidelines will prevent new infections and death.
All data and subsequent figures were produced using the R programming software. For those interested in the code, please feel free to contact the author nicholas.j.blasco.civ@mail.mil
Nicholas Blasco is a Postdoctoral Fellow in the Homeland Defense and Security Issues Group at the United States Army War College. The views expressed in this article are those of the author and do not necessarily reflect those of the U.S. Army War College, the U.S. Army, or the Department of Defense.
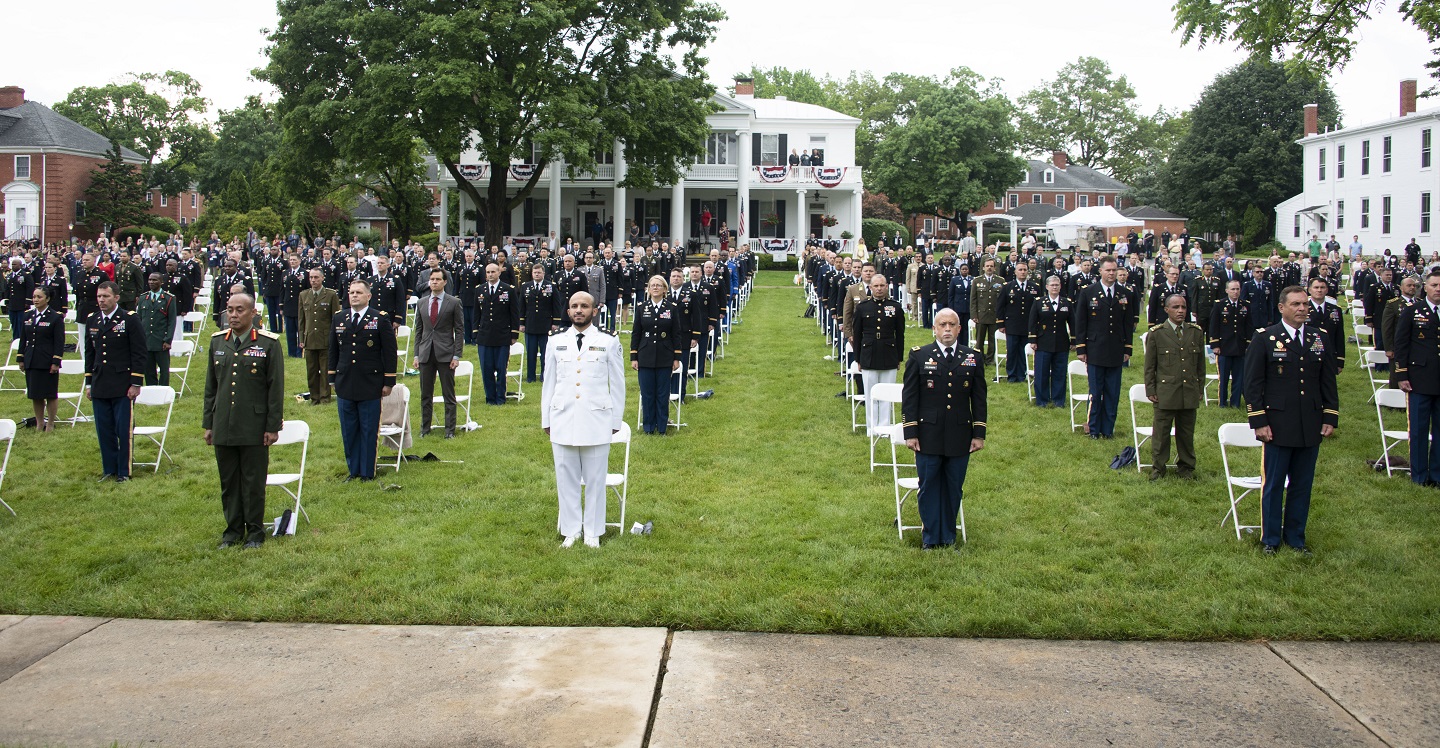
Photo Description: The AY20 Resident Class of the U.S. Army War College stands at attention as the commencement ceremony begins on 5 June, 2020. Social distancing was observed for the entirety of the ceremony. This class completed nearly a third of their studies via remote means during the COVID-19 outbreak.
Photo Credit: U.S. Army War College
Other releases in the “COVID-19” series:
- READINESS EFFECTS ON THE U.S. ARMY OCONUS DURING COVID-19
- SURPRISE! YOUR ORGANIZATION NEEDS CHANGE
- NATIONAL EMERGENCY RESPONSE: THE BENS REPORT
- COVID-19 AND THE INFORMATION WAR: CHANGING THE NARRATIVE
- SARS-COV-2 AND THE WAR AGAINST WMD (COVID-19 SERIES)
- WHAT IF COVID-19 ENTERED THE CARLISLE BARRACKS?: A SIMULATION OF INSTALLATION CONTAGION
- OWING AND OWNING: LATIN AMERICA, CHINA, AND THE PANDEMIC
- THE FEW, THE PROUD, THE LAST: MARINE CORPS RECRUITING AND GAMING IN A COVID-19 WORLD
- CULTURAL TERRAIN IN DOMESTIC OPERATIONS
- A NEW WASHINGTON NAVAL CONFERENCE FOR A POST-COVID WORLD?